- Home |
- About |
- Contact Us |
- Privacy |
- Newsletter |
- Shop |
- Donate
Bar Graph Worksheets
Hub Page

Welcome to the Math Salamanders Bar Graph Worksheets.
Here you will find our range of bar and picture graph worksheets which involve reading and interpreting bar graphs.
There are a wide range of bar graph sheets suitable for children across the elementary age group, from 1st to 5th grade.
Activities include reading and interpreting bar graphs as well as drawing missing bars.
- This page contains links to other Math webpages where you will find a range of activities and resources.
- If you can't find what you are looking for, try searching the site using the Google search box at the top of each page.
Bar Graph Worksheets
What is the difference between a bar graph and a bar chart?
A bar graph and a bar chart refer to the same thing.
Sometimes a bar graph or bar chart can also be refered to as a bar diagram.
What is the difference between a bar graph and a picture graph?
Features of a bar graph
- The bars are the same thickness.
- The bars usually go vertically, but they can also lie horizontally in a horizontal bar graph.
- The height of the bar (or width in a horizonal bar graph) show the data.
- The bars have the same starting point on the x-axis.
- There is usually a numerical scale on the y-axis showing the amount represented by the bars.
Features of a bar graph
- The data is represented by pictorial symbols instead of bars.
- Each symbol usually represents one of the object is represents, though it can represent more (or less) than one object.
- A key is usually used to show what each symbol represents.
- There is no numerical scale on the y-axis
Understanding Bar Graphs
When teaching children about bar graphs, there is usually a focus on getting children to draw and label a graph accurately which is worthwhile.
What is often neglected though, is the interpretation of bar graphs, and an analysis of what the data is showing.
This skills is equally as important as the skill of drawing the graph in the first place.
The sheets on this page involve interpreting bar graphs and answering questions about the data. There are also some activities which involve drawing missing bars, or saying whether a statement about the data is true or false.
It is really important that children look carefully at the scale on a bar graph so they can read and interpret it correctly.
There are also a few picture graphs (or pictograms) with each picture representing one or more units.
It is really important with pictographs to look at the key, so that they know how much each picture represents.
Using these sheets will help your child to:
- read and interpret bar graphs going up in different size steps;
- draw bars accurately from 2nd grade and upwards;
- answer questions involving data.
The worksheets have been split up by grade in the section below.
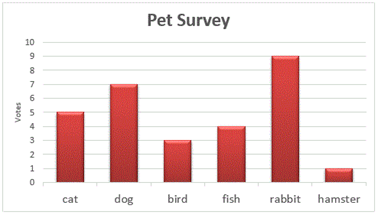
1st Grade Bar Graph Worksheets
At a first grade level, the bar graphs are shown very simply, with the scale going up in ones.
The pictograms are also simple with each symbol representing one unit.
The questions are straightforward and simply involve saying how much each bar is worth, or what the most or least is.
We also have some tally chart worksheets to help children understand how tally charts work.


2nd Grade Bar Graph Worksheets
At a second grade level, the bar graphs are starting to become a little more complicated.
The scale might be going up in ones or twos.
The pictograms are still quite simple with each symbol representing one unit.
The questions are more varied now, asking how many more, or how many less. The interpretation of the graph is becoming a little more difficult.
3rd Grade Bar Graph Sheets
At a 3rd grade level, the bar graphs are now showing a range of different scales such as 2s, 5s, 10s, 100s.
The pictograms are becoming more complex with each symbol representing more than one unit.
The questions are more varied, asking how many more, or how many less, the total of several bars combined. The interpretation of the graph is becoming more difficult.
On this page there are a selection of bar and picture graphs, including bar graphs with real-life data such as tree heights.

4th Grade Bar Graph Sheets
At a 4th grade level, the bar graphs are becoming more complex and involve decimals and larger numbers.
The scales used at 4th grade are varied, and may include decimal scales.
The questions are probably at the same sort of level as 3rd grade, but the complexity of the data makes them harder.
More Recommended Math Worksheets
Take a look at some more of our worksheets similar to these.
What is a Line Plot?
If you want to know about line plots, then this page is for you!
Find out the difference between a line graph and a line plot; create and interpret and range of line plots with our online quizzes.

What is a Box Plot?
If you are looking for some more help and support with box plots, then try the link below.
The box plot support page below will help you to learn all about box plots and how they work.

How to Print or Save these sheets 🖶
Need help with printing or saving?
Follow these 3 steps to get your worksheets printed perfectly!
How to Print or Save these sheets 🖶
Need help with printing or saving?
Follow these 3 steps to get your worksheets printed perfectly!
Subscribe to Math Salamanders News
Sign up for our newsletter to get free math support delivered to your inbox each month. Plus, get a seasonal math grab pack included for free!
Math-Salamanders.com
![]()
The Math Salamanders hope you enjoy using these free printable Math worksheets and all our other Math games and resources.
If you have any questions or need any information about our site, please get in touch with us using the 'Contact Us' tab at the top and bottom of every page.