- Home |
- About |
- Contact Us |
- Privacy |
- Newsletter |
- Shop |
- Donate
Data and Statistics Worksheets
Hub Page

Welcome to our Data and Statistics Worksheets hub page.
Here you will find links to lots of data handling and analysis worksheet webpages, which will help your child become more confident in handling and interpreting a range of data.
Why not take a look at some of our bar graph worksheets, or have a go at some of our Mean, Median and Mode sheets?
We also have a selection of venn diagram and line graph worksheets.
- This page contains links to other Math webpages where you will find a range of activities and resources.
- If you can't find what you are looking for, try searching the site using the Google search box at the top of each page.
Geometry Worksheets
Resources by Grade
- All Grades
- 1st Grade Data & Statistics
- 2nd Grade Data & Statistics
- 3rd Grade Data & Statistics
- 4th Grade Data & Statistics
- 5th Grade Data & Statistics
- 6th Grade Data & Statistics
Resources by Topic
Statistics Worksheets
Resources Indexed by Grade
1st Grade Data Handling and Statistics


2nd Grade Data Handling and Statistics

3rd Grade Data Handling and Statistics

4th Grade Data Handling and Statistics


5th Grade Data Handling and Statistics


6th Grade Data Handling and Statistics


Tally Chart Worksheets
Here is our selection of tally chart worksheets for 1st and 2nd graders.
These sheets involve counting and recording tallies.
Line Plot Worksheets
These worksheets involve creating and interpreting a range of line plots.
Bar Graph Worksheets
Here you will find our range of statistics worksheets involving using bar graphs, picture graphs and line graphs.
There is a wide range of different sheets at each level, and each sheet comes with its own set of answers.

Line Graph Worksheets
Here is our selection of line graph worksheets.
The worksheets on this page involve plotting and analysing a range of line graphs.
Using these sheets will help your child to:
- plot points on a line graph;
- analyse data points on a line graph;
- answer questions involving line graphs.
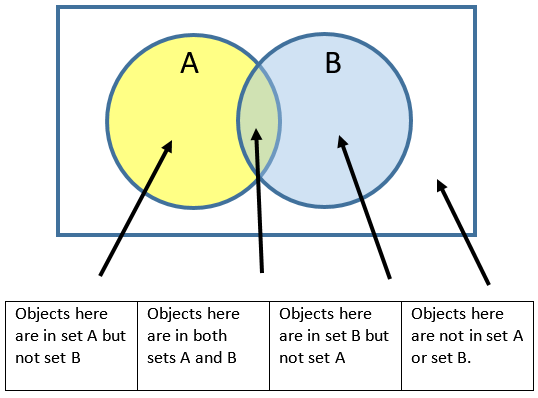
Venn Diagram Worksheets
Here are our selection of venn diagram worksheets to help you sort a range of different objects.
There are a selection of 2 and 3 circle venn diagram worksheets.
Our worksheets cover sorting animals and people, to sorting shapes and numbers.

Mode, Mean, Median and Range
Median Worksheets
Find links to our Median worksheets below.
Using this webapge will help you to:
- find the median of a set of data;
- find the median of both odd and even numbers of data points;
- show you worked examples of how to find the median.
Mean Worksheets
Find links to our Mean worksheets below.
Using these sheets will help you to:
- find the mean of up to 5 numbers;
- find the mean of a range of numbers, including negative numbers and decimals;
- find a missing data point when the mean is given.
Mode and Range Worksheets
Find links to our Mode and Range worksheets below.
Using these sheets will help you to:
- find the mode of a list of numbers numbers;
- find the range of a list of numbers;
- see worked examples of how to find the mode and range of a set of data.
Mean Median Mode and Range Worksheets
The sheets in this section will help you to find the mean, median, mode and range of a set of numbers, including negative numbers and decimals.
There are easier sheets involving fewer data points, and harder ones with more data points.

Box Plots, Line Plots & Line Graphs Support Pages
Here are our information pages about box plots and line plots to help you understand what they are and how they work.


How to Print or Save these sheets 🖶
Need help with printing or saving?
Follow these 3 steps to get your worksheets printed perfectly!
How to Print or Save these sheets 🖶
Need help with printing or saving?
Follow these 3 steps to get your worksheets printed perfectly!
Subscribe to Math Salamanders News
Sign up for our newsletter to get free math support delivered to your inbox each month. Plus, get a seasonal math grab pack included for free!
Math-Salamanders.com
![]()
The Math Salamanders hope you enjoy using these free printable Math worksheets and all our other Math games and resources.
If you have any questions or need any information about our site, please get in touch with us using the 'Contact Us' tab at the top and bottom of every page.